Introduction
OpenTelemetry is an open-source observability framework that provides a standardized way to generate, collect, analyze, and export telemetry data from distributed systems. It allows developers to instrument their applications and services to collect trace data, metrics, and logs, and then export them to various backend systems for analysis.
OpenTelemetry is designed to be ‘vendor-agnostic’ and works with a variety of programming languages and platforms. It also supports various protocols and formats, such as OpenTracing and OpenCensus, and integrates with popular observability tools such as Jaeger, Zipkin, Prometheus, and Grafana.
Three pillars of Observability:
Logs: The application story
Metrics: Number telling the statistical facts about the system.
Traces: The context of why things are happening.
Open Telemetry is a SDK (Software Development Kit) and has the ability to collect the logs, metrics and traces.
Open Telemetry – Stack:
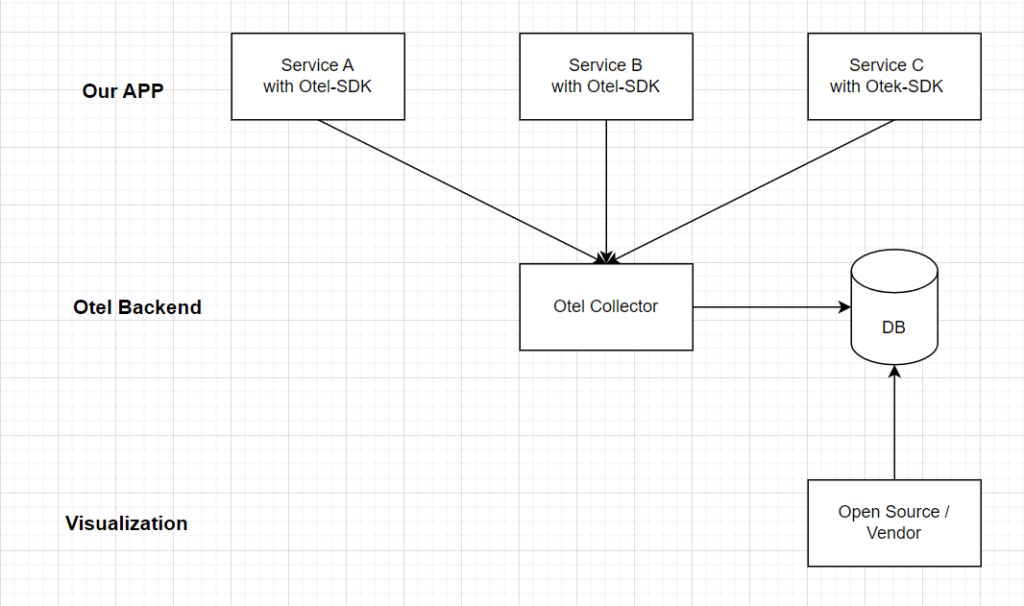
Otel SDK – collects traces, logs and metrics and export them.
Otel Collector – Receives telemetry data and process it and export it.
DB – to store Telemetry data.
Instrumenting:
In order to make a system (App) observable, it must be instrumented. That means, code from the system (App)’s components must emit traces, metrics, and logs. Without modifying the source code, we can collect telemetry data from an application using Automatic Instrumentation.
Note: To facilitate the instrumentation of applications even more, we can manually instrument our applications by coding against the OpenTelemetry APIs.
1. Automatic Instrumentation:
Patches/Attaches to a library.
Collect data library activities in runtime.
Produces spans based on specification and semantic-conventions.
May offer additional configuration/features.
List of all auto-instrumentation:
 Registry
2. Manual Instrumentation.
App developer writes dedicated code.
starts and end span, set status.
common use cases for manual instrumentation: Internal activities (timers), adding data (user id).
Automatic Instrumentation of a JAVA application
We implemented this observability scenario by using code that contains an existing microservice written in Java and Spring Boot, and a pre-configured observability backend. This observability backend is based on Grafana Tempo for handling tracing data, Prometheus for metrics, and Grafana for visualizing both types of telemetry data.
The repository containing this existing code can be found here: https://github.com/bprasad701/instrumenting-java-apps-using-opentelemetry.git
However, instead of using the complete code already implemented, use a specific branch of this code called build-on-aws-tutorial that is incomplete.
Clone the repository.
First, check if the microservice can be compiled, built, and executed. This will require us to have Java and Maven properly installed on our machine. The script run-microservice.sh builds the code and also executes the microservice at the same time.
2. Change the directory to the folder containing the code.
3. Execute the script run-microservice.sh.
This is the log output from the microservice:
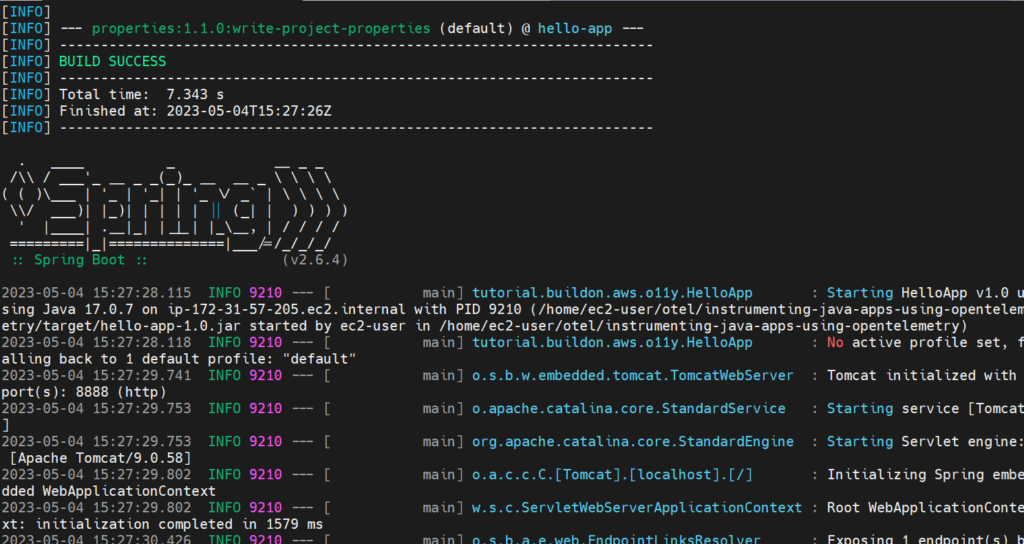
The microservice exposes a REST API over port 8888.
Next, we will test if the API is accepting requests.
4. Send an HTTP request to the API.
curl -X GET http://localhost:8888/hello
we should receive a reply like this:
{"message":"Hello World"}
Once we are done with the tests, stop run-microservice.sh to shut down the microservice. we can do this by pressing Ctrl+C.
Note: From this point on, every time we need to execute the microservice again with a new version of the code that we changed, just execute the same script.
Now we need to check the observability backend. As mentioned before, this is based on Grafana Tempo, Prometheus, and Grafana. The code contains a docker-compose.yaml file with the three services pre-configured.
5. Start the observability backend using:
docker compose up -d
It may take several minutes until this command completes, as the respective container images need to be downloaded. But once it finishes, we should have Grafana Tempo running on port 3200, Prometheus running on port 9090, and Grafana running on port 3000.
Let’s check if they are actually running.
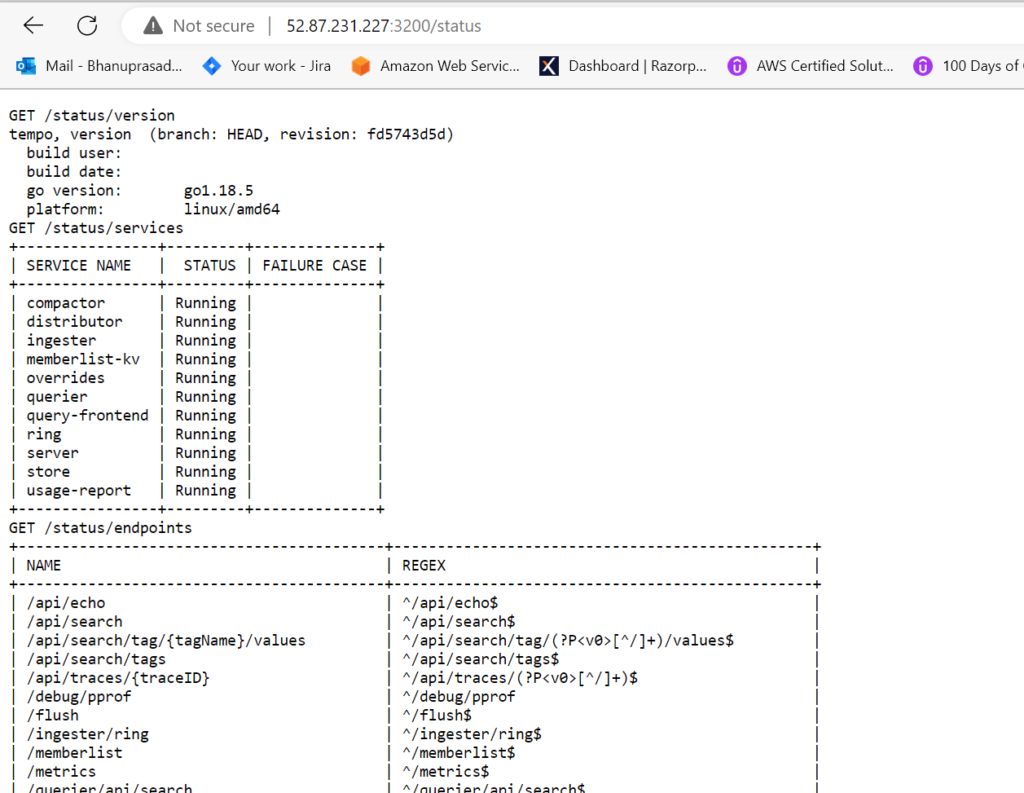
6. Open a browser and point the location to http://<server_ip>:3200/status.
we should see the following page:
7. Point your browser to http://<server_ip>:9090/status.
We should see the following page:
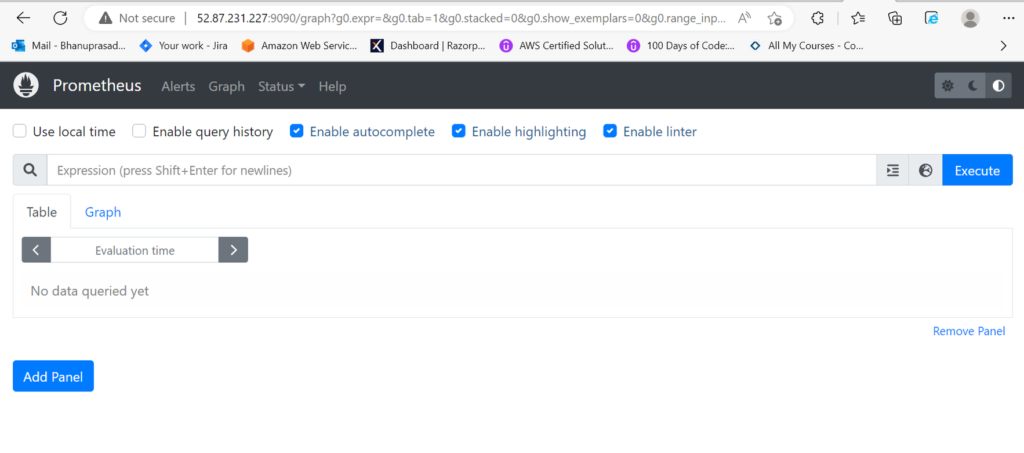
8. Point your browser to http://<server_ip>:3000/status.
We should see the following page:
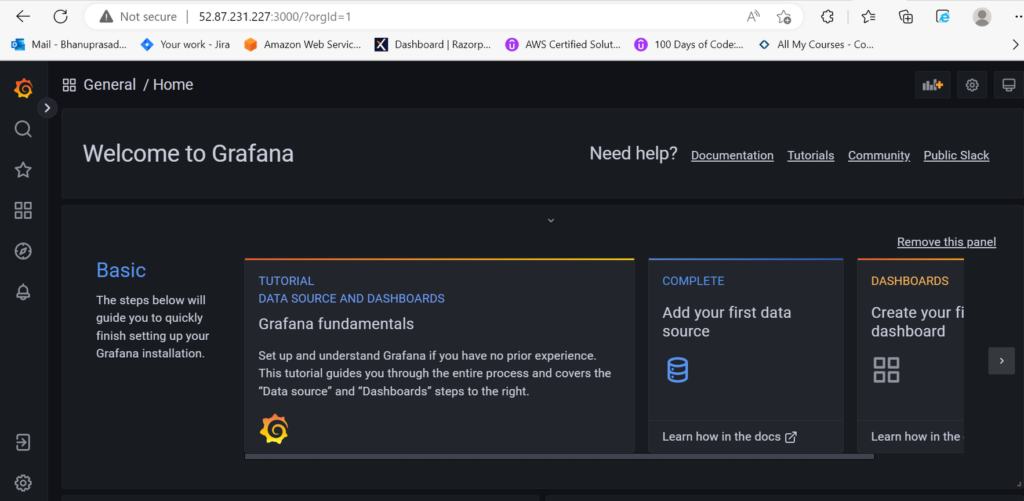
9. Stop the observability backend using
docker compose down
Automatic instrumentation with the OpenTelemetry agent:
We have our microservice ready to go, the observability backend is eager to receive telemetry data, so now it is time for us to start the instrumentation process. This is the process where we teach the code how to emit telemetry data.
Since this microservice has been written in Java, we can leverage Java’s agent architecture to attach an agent that can automatically add instrumentation code during the JVM bootstrap.
Edit the file
run-microservice.sh.
We will change the code in run-microservice.sh to instruct the script to download the agent for OpenTelemetry that will instrument the microservice during bootstrap.
Here is how the updated script should look like.
#!/bin/bash
mvn clean package -Dmaven.test.skip=trueAGENT_FILE=opentelemetry-javaagent-all.jar
if [ ! -f "${AGENT_FILE}" ]; then curl -L https://github.com/aws-observability/aws-otel-java-instrumentation/releases/download/v1.19.2/aws-opentelemetry-agent.jar --output ${AGENT_FILE}fi
java -javaagent:./${AGENT_FILE} -jar target/hello-app-1.0.jar
2. Execute the script run-microservice.sh.
After the changes, we will notice that nothing much will happen. It will continue to serve HTTP requests sent to the API as it would normally do. However, be sure that traces and metrics are being generated already. They are just not being properly processed. The OpenTelemetry agent is configured by default to export telemetry data to a local OTLP endpoint running on port 4317. This is the reason why you will see messages like this in the logs:
[otel.javaagent 2022-08-25 11:18:14:865 -0400] [OkHttp http://localhost:4317/...] ERROR io.opentelemetry.exporter.internal.grpc.OkHttpGrpcExporter - Failed to export spans. The request could not be executed. Full error message: Failed to connect to localhost/[0:0:0:0:0:0:0:1]:4317
We will fix this later. But for now, we can visualize the traces and metrics created using plain old logging. Yes, the oldest debugging technique is available for the OpenTelemetry agent as well. To enable logging for your telemetry data:
3. Edit the file run-microservice.sh.
Here is how the updated run-microservice.sh file should look:
#!/bin/bash
mvn clean package -Dmaven.test.skip=trueAGENT_FILE=opentelemetry-javaagent-all.jar
if [ ! -f "${AGENT_FILE}" ]; then curl -L https://github.com/aws-observability/aws-otel-java-instrumentation/releases/download/v1.19.2/aws-opentelemetry-agent.jar --output ${AGENT_FILE}fi
export OTEL_TRACES_EXPORTER=loggingexport OTEL_METRICS_EXPORTER=logging
java -javaagent:./${AGENT_FILE} -jar target/hello-app-1.0.jar
4. Execute the script run-microservice.sh.
5. Send an HTTP request to the API.
curl -X GET http://localhost:8888/hello
Now we will notice that in the logs there will be an entry like this:

This is a root span, a type of trace data, generated automatically by the OpenTelemetry agent. A root span will be created for every single execution of the microservice, meaning that if we send 5 HTTP requests to its API, then 5 root spans will be created.
If we keep the microservice running for over one minute, we will also see entries like this in the logs.

These are metrics generated automatically by the OpenTelemetry agent, that are updated every minute.
So microservice is already generating useful telemetry data for traces and metrics without changing a single line of its code. It was achieved by one of the moving parts of OpenTelemetry called the agent.
Agent: component responsible for collecting the generated telemetry data and sending to a destination.
Sending telemetry data to the collector:
OpenTelemetry allows you to collect, process, and transmit the telemetry data to observability backends using a collector. Collector acts as a glue between our instrumented code that generates telemetry data and the observability backend.
Using the collector is straightforward. All we need to do is to create a configuration file that describes how the processing pipeline should work. A processing pipeline comprises three components: one or more receivers, optional processors, and one or more exporters.
Create a file named
collector-config-local.yamlwith the following content:
receivers: otlp: protocols: grpc: endpoint: 0.0.0.0:5555
exporters: logging: loglevel: debug
service: pipelines: metrics: receivers: [otlp] exporters: [logging] traces: receivers: [otlp] exporters: [logging]
In this example, we want the collector to expose an endpoint over the port 5555 that will accept connections over gRPC using the OTLP protocol. Then, we will export any data received to the logging, whether these data are traces or metrics.
2. Execute the collector with a container:
docker run -v $(pwd)/collector-config-local.yaml:/etc/otelcol/config.yaml -p 5555:5555 otel/opentelemetry-collector:latest
We should see the following output:
2023-05-09T19:40:25.895Z info service/telemetry.go:102 Setting up own telemetry...2023-05-09T19:40:25.895Z info service/telemetry.go:137 Serving Prometheus metrics {"address": ":8888", "level": "basic"}2023-05-09T19:40:25.895Z info components/components.go:30 In development component. May change in the future. {"kind": "exporter", "data_type": "traces", "name": "logging", "stability": "in development"}2023-05-09T19:40:25.895Z info components/components.go:30 In development component. May change in the future. {"kind": "exporter", "data_type": "metrics", "name": "logging", "stability": "in development"}2023-05-09T19:40:25.896Z info extensions/extensions.go:42 Starting extensions...2023-05-09T19:40:25.896Z info pipelines/pipelines.go:74 Starting exporters...2023-05-09T19:40:25.896Z info pipelines/pipelines.go:78 Exporter is starting... {"kind": "exporter", "data_type": "traces", "name": "logging"}2023-05-09T19:40:25.896Z info pipelines/pipelines.go:82 Exporter started. {"kind": "exporter", "data_type": "traces", "name": "logging"}2023-05-09T19:40:25.896Z info pipelines/pipelines.go:78 Exporter is starting... {"kind": "exporter", "data_type": "metrics", "name": "logging"}2023-05-09T19:40:25.896Z info pipelines/pipelines.go:82 Exporter started. {"kind": "exporter", "data_type": "metrics", "name": "logging"}2023-05-09T19:40:25.896Z info pipelines/pipelines.go:86 Starting processors...2023-05-09T19:40:25.896Z info pipelines/pipelines.go:98 Starting receivers...2023-05-09T19:40:25.896Z info pipelines/pipelines.go:102 Receiver is starting... {"kind": "receiver", "name": "otlp", "pipeline": "traces"}2023-05-09T19:40:25.896Z info otlpreceiver/otlp.go:70 Starting GRPC server on endpoint 0.0.0.0:5555 {"kind": "receiver", "name": "otlp", "pipeline": "traces"}2023-05-09T19:40:25.896Z info pipelines/pipelines.go:106 Receiver started. {"kind": "receiver", "name": "otlp", "pipeline": "traces"}2023-05-09T19:40:25.896Z info pipelines/pipelines.go:102 Receiver is starting... {"kind": "receiver", "name": "otlp", "pipeline": "metrics"}2023-05-09T19:40:25.896Z info pipelines/pipelines.go:106 Receiver started. {"kind": "receiver", "name": "otlp", "pipeline": "metrics"}2023-05-09T19:40:25.896Z info service/collector.go:215 Starting otelcol... {"Version": "0.56.0", "NumCPU": 4}2023-05-09T19:40:25.896Z info service/collector.go:128 Everything is ready. Begin running and processing data.
Leave this collector running for now.
3. Edit the file run-microservice.sh.
Here is how the updated run-microservice.sh file should look:
#!/bin/bash
mvn clean package -Dmaven.test.skip=trueAGENT_FILE=opentelemetry-javaagent-all.jar
if [ ! -f "${AGENT_FILE}" ]; then curl -L https://github.com/aws-observability/aws-otel-java-instrumentation/releases/download/v1.19.2/aws-opentelemetry-agent.jar --output ${AGENT_FILE}fi
export OTEL_TRACES_EXPORTER=otlpexport OTEL_METRICS_EXPORTER=otlpexport OTEL_EXPORTER_OTLP_ENDPOINT=http://localhost:5555export OTEL_RESOURCE_ATTRIBUTES=service.name=hello-app,service.version=1.0
java -javaagent:./${AGENT_FILE} -jar target/hello-app-1.0.jar
Save the changes and execute the microservice. Then, send a HTTP request to its API.
4. Send an HTTP request to the API.
curl -X GET http://localhost:8888/hello
We will notice that in the logs from the collector, there will be the following output:
2023-05-09T19:50:23.289Z info TracesExporter {"kind": "exporter", "data_type": "traces", "name": "logging", "#spans": 2}2023-05-09T19:50:23.289Z info ResourceSpans #0Resource SchemaURL: https://opentelemetry.io/schemas/1.9.0Resource labels: -> host.arch: STRING(x86_64) -> host.name: STRING(b0de28f1021b.ant.amazon.com) -> os.description: STRING(Mac OS X 12.5.1) -> os.type: STRING(darwin) -> process.command_line: STRING(/Library/Java/JavaVirtualMachines/amazon-corretto-17.jdk/Contents/Home:bin:java -javaagent:./opentelemetry-javaagent-all.jar) -> process.executable.path: STRING(/Library/Java/JavaVirtualMachines/amazon-corretto-17.jdk/Contents/Home:bin:java) -> process.pid: INT(28820) -> process.runtime.description: STRING(Amazon.com Inc. OpenJDK 64-Bit Server VM 17.0.2+8-LTS) -> Runtime — HTML clock widgets for your website : STRING(OpenJDK Runtime Environment) -> process.runtime.version: STRING(17.0.2+8-LTS) -> service.name: STRING(hello-app) -> service.version: STRING(1.0) -> telemetry.auto.version: STRING(1.16.0-aws) -> telemetry.sdk.language: STRING(java) -> telemetry.sdk.name: STRING(opentelemetry) -> telemetry.sdk.version: STRING(1.16.0)ScopeSpans #0ScopeSpans SchemaURL:InstrumentationScope io.opentelemetry.spring-webmvc-3.1 1.16.0-alphaSpan #0 Trace ID : 6307d27bed1faa3e31f7ff3f1eae4ecf Parent ID : 27e7a5c4a62d47ba ID : e8d5205e3f86ff49 Name : HelloAppController.hello Kind : SPAN_KIND_INTERNAL Start time : 2023-05-09 19:50:19.89690875 +0000 UTC End time : 2023-05-09 19:50:20.071752042 +0000 UTC Status code : STATUS_CODE_UNSET Status message :Attributes: -> Domain Registered at Safenames : STRING(http-nio-8888-exec-1) -> Thread : INT(25)ScopeSpans #1ScopeSpans SchemaURL:InstrumentationScope io.opentelemetry.tomcat-7.0 1.16.0-alphaSpan #0 Trace ID : 6307d27bed1faa3e31f7ff3f1eae4ecf Parent ID : ID : 27e7a5c4a62d47ba Name : /hello Kind : SPAN_KIND_SERVER Start time : 2023-05-09 19:50:19.707696 +0000 UTC End time : 2023-05-09 19:50:20.099723333 +0000 UTC Status code : STATUS_CODE_UNSET Status message :Attributes: -> http.status_code: INT(200) -> net.peer.ip: STRING(127.0.0.1) -> Domain Registered at Safenames : STRING(http-nio-8888-exec-1) -> http.host: STRING(localhost:8888) -> http.target: STRING(/hello) -> http.flavor: STRING(1.1) -> net.transport: STRING(ip_tcp) -> Thread : INT(25) -> http.method: STRING(GET) -> http.scheme: STRING(http) -> net.peer.port: INT(55741) -> http.route: STRING(/hello) -> http.user_agent: STRING(curl/7.79.1) {"kind": "exporter", "data_type": "traces", "name": "logging"}
This means that the generated root span from the microservice was successfully transmitted to the collector, which then exported the data to the logging.
Note: It will take a couple seconds for the data to actually be printed into the collector logging. This is because by default the collector tries to buffer data as much as it can and flush periodically to the configured exporters.
We can tweak this behavior by adding a batch processor to the processing pipeline that flushes the data every second.
Now stop both the microservice and the collector.
5. Edit the file collector-config-local.yaml
Here is how the updated collector-config-local.yaml file should look:
receivers: otlp: protocols: grpc: endpoint: 0.0.0.0:5555
processors: batch: timeout: 1s send_batch_size: 1024
exporters: logging: loglevel: debug
service: pipelines: metrics: receivers: [otlp] processors: [batch] exporters: [logging] traces: receivers: [otlp] processors: [batch] exporters: [logging]
Here we have added a processor into the processing pipeline to change the batching behavior, and applied that processor for both the metrics and traces pipelines. This means that if the microservice now sends either traces or metrics to the collector, it will flush whatever has been buffered every second or until the buffer reaches 1K of size. You can check this behavior by executing the collector again, then executing the microservice one more time, and sending another HTTP request to its API.
Now that the microservice is properly sending telemetry data to the collector, and the collector works as expected, we can start preparing the collector to transmit telemetry data to the observability backend. Therefore, it is a good idea to have the collector being executed along with the observability backend. We can do this by adding a new service in the file docker-compose.yaml that represents the collector.
6. Edit the file docker-compose.yaml
We need to include the following service before Grafana Tempo:
collector: image: otel/opentelemetry-collector:latest container_name: collector hostname: collector depends_on: tempo: condition: service_healthy prometheus: condition: service_healthy command: ["--config=/etc/collector-config.yaml"] volumes: - ./collector-config-local.yaml:/etc/collector-config.yaml ports: - "5555:5555" - "6666:6666"
The code is now in good shape so we can switch our focus to the observability backend, and how to configure the collector to send data to it.
Sending all the traces to Grafana Tempo:
We were using the logging from the console to visualize telemetry data. While logging is great for debugging and troubleshooting purposes, it is not very useful to analyze large amounts of telemetry data. This is particularly true for traces, where you would like to see the complete flow of the code using visualizations such as the timelines or waterfalls. This is why you are going to configure the collector to send the traces to Grafana Tempo.
Grafana Tempo is a tracing backend compatible with OpenTelemetry and other technologies that can process the received spans and make them available for visualization using Grafana.
Edit the file
collector-config-local.yaml.
Here is how the updated collector-config-local.yaml file should look:
receivers: otlp: protocols: grpc: endpoint: 0.0.0.0:5555
processors: batch: timeout: 1s send_batch_size: 1024
exporters: logging: loglevel: debug otlp: endpoint: tempo:4317 tls: insecure: true
service: pipelines: metrics: receivers: [otlp] processors: [batch] exporters: [logging] traces: receivers: [otlp] processors: [batch] exporters: [logging, otlp]
We have added a new exporter called otlp that sends telemetry data to the endpoint tempo:4317. The port 4317 is being used by Grafana Tempo to receive any type of telemetry data; and since TLS is disabled in that port, the option insecure was used. Then, we have updated the traces pipeline to include another exporter along with the logging.
2. Start the observability backend using:
docker compose up -d
3. Execute the script run-microservice.sh.
sh run-microservice.sh
4. Send a couple HTTP requests to the microservice API like we did in past steps.
5. Open the browser and point to: http://<server_ip>:3000.
6. Click on the option to Explore on Grafana.
7. In the drop-down at the top, select the option Tempo.
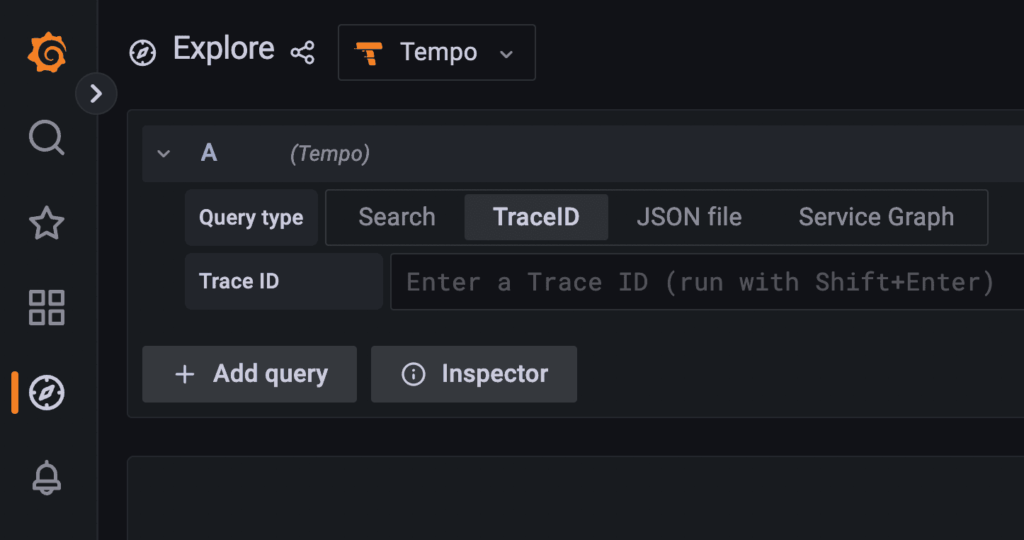
8. Click on the Search tab.
9. In the Service Name drop-down, select the option hello-app.
10. In the Span Name drop-down, select the option /hello.
11. Click on the blue button named Run query in the upper right corner of the UI.
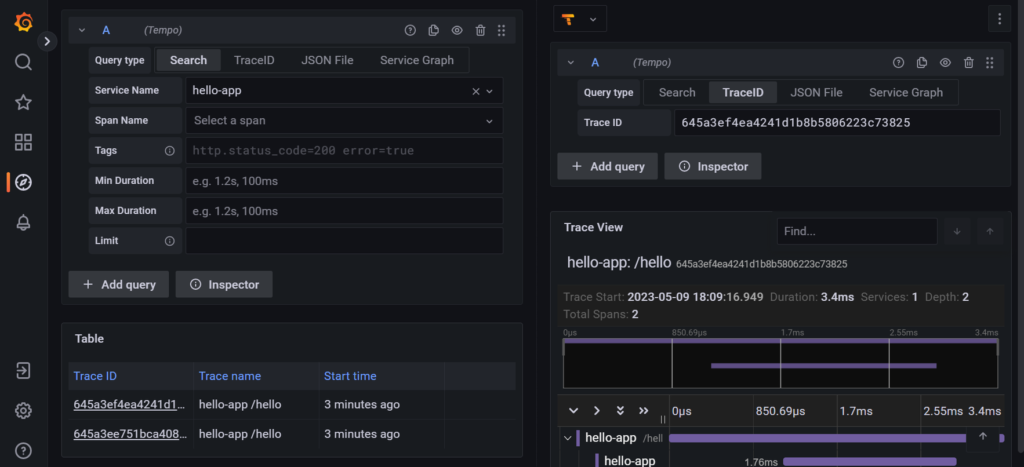
We should see the following result:
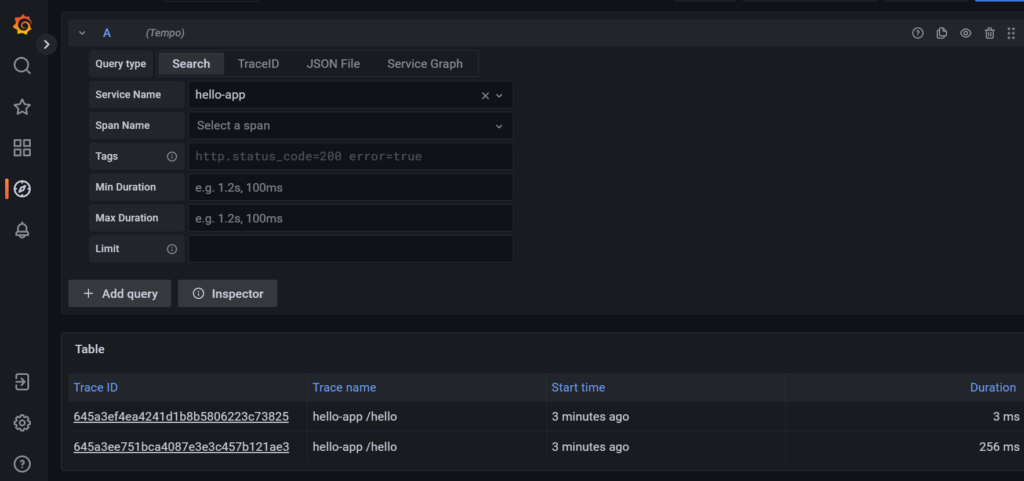
These are the two traces generated when you sent two HTTP requests to the microservice API. To visualize the trace:
12. Click on the Trace ID link for one of the traces.
Grafana splits the screen in two, and on the right side of the screen, it will show the details of the selected trace.
Conclusion
In summary, the blog adeptly guides developers in seamlessly integrating OpenTelemetry into Java applications for automatic instrumentation. The practical steps, including connecting to an observability backend and utilizing Grafana Tempo, offer a concise yet comprehensive overview of OpenTelemetry’s effectiveness. The focus on automatic instrumentation, facilitated by the OpenTelemetry agent, underscores the simplicity and efficiency of the implementation. Overall, the blog is a valuable resource for developers seeking to elevate the monitoring and analysis of distributed systems through OpenTelemetry.

